The importance of staying in your seat when things get bumpy
You’re flying over the Bay of Biscay enroute to the Costa Blanca enjoying a glass of red wine in business class when things start to get bumpy and soon after, the captain turns on the seat belt sign.
You hear “Ladies and gentleman, the captain has turned on the seat belt sign. We ask that you return to your seats immediately and secure all loose objects.”
The captain comes on the PA to announce that they are expecting a brief spell of moderate turbulence ahead, but not to be concerned.
You quickly finish your glass as the aircraft starts rocking from side to side and up and down.
The passenger to the right of you in the window seat seems to be enjoying the ‘rollercoaster’ whilst the passenger to your left in the aisle seat is motionless and has a firm grip on their armrests. You’re taking it in your stride and accept it is all part of flying.
Not everyone has the same appetite for turbulence!
This analogy also applies to investing in the stockmarket. As we have seen in the last couple of months since President Trump came to office, markets have dropped measurably, falling by 7% in 2 monthsi. Turbulence, known as market volatility, is part and parcel of your investment journey.
For your journey down to the Costa Blanca, the turbulence is likely to be within the aircraft’s safety envelope – the captain was not concerned. Similarly, our model portfolios are carefully designed with expected characteristics that fall within their own ‘safety envelopes’ that we call “expected range of returns”. The recent declines in your portfolio are within the anticipated range of returns.
You might feel inclined to move your portfolio to the relative safety of cash, planning to re-enter the market when conditions seem more stable. However, attempting to time the market to avoid the worst days could result in missing some of the best days, as illustrated in the graph below.
S&P 500 Index Performance Based on Time in the Market (1990–2023)
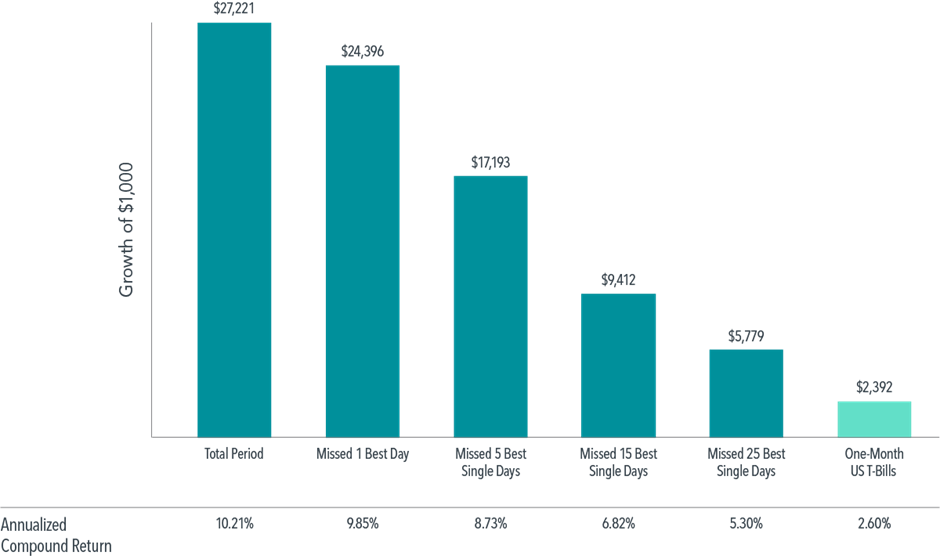
An investment of $1,000 in the S&P 500 Index in 1990 would have appreciated to $27,221 by the end of 2023 if left unaltered. Conversely, had an investor withdrawn their funds and missed the single best day within the more than 30-year period, their ending wealth would be diminished by nearly $3,000. Moreover, missing the five best days would result in a reduction in the final wealth by over $10,000. This illustrates that even a few days can significantly impact long term investment outcomes.
Taking a broader view beyond immediate circumstances can offer investors valuable perspective and alleviate concerns. Historically, markets have risen over the decades, notwithstanding global events, and have rewarded those who maintained discipline over time. This serves as a reminder that, despite sensational headlines and short term volatility, remaining invested may yield better results.
Know your thrill tolerance
People have different levels of tolerance for turbulence and may prefer to travel by road, rail, or sea. Similarly, in the investing world, tolerance to market volatility varies among investors. Some investors are comfortable with high volatility while others prefer a cautious and stable investment journey.
As financial professionals, it is our job to ensure that you are invested in the most appropriate investment strategy based on your objectives, investment horizon, risk profile, and capacity for loss. We assess this during your review meetings.
Investing is a long-term process, and by staying invested through periods of volatility, you can capture returns from future market recoveries.
If you wish to discuss your portfolio in more detail or have any concerns, please contact us. We are here to assist you during these times.
As we navigate market turbulence, it’s crucial to stay invested. Just as you remain seated during flight turbulence, staying in your seat through market volatility can lead to long term rewards on your investment journey.
Daniel Perkin, Technical Director
iMeasured by the MSCI All Country World Index (Net Div., GBP) between 20th January 2025 to 20th March 2025. ii Indices are not available for direct investment; therefore, their performance does not reflect the expenses associated with the management of an actual portfolio. In USD. For illustrative purposes. The missed best day(s) examples assume that the hypothetical portfolio fully divested its holdings at the end of the day before the missed best day(s), held cash for the missed best day(s), and reinvested the entire portfolio in the S&P 500 at the end of the missed best day(s). Annualized returns for the missed best day(s) were calculated by substituting actual returns for the missed best day(s) with zero. S&P data © 2024 S&P Dow Jones Indices LLC, a division of S&P Global. All rights reserved. One-Month US T-Bills is the IA SBBI US 30 Day TBill TR USD, provided by Ibbotson Associates via Morningstar Direct. Data is calculated off rounded daily index values.